
Study the given diagram and answer the question that follow.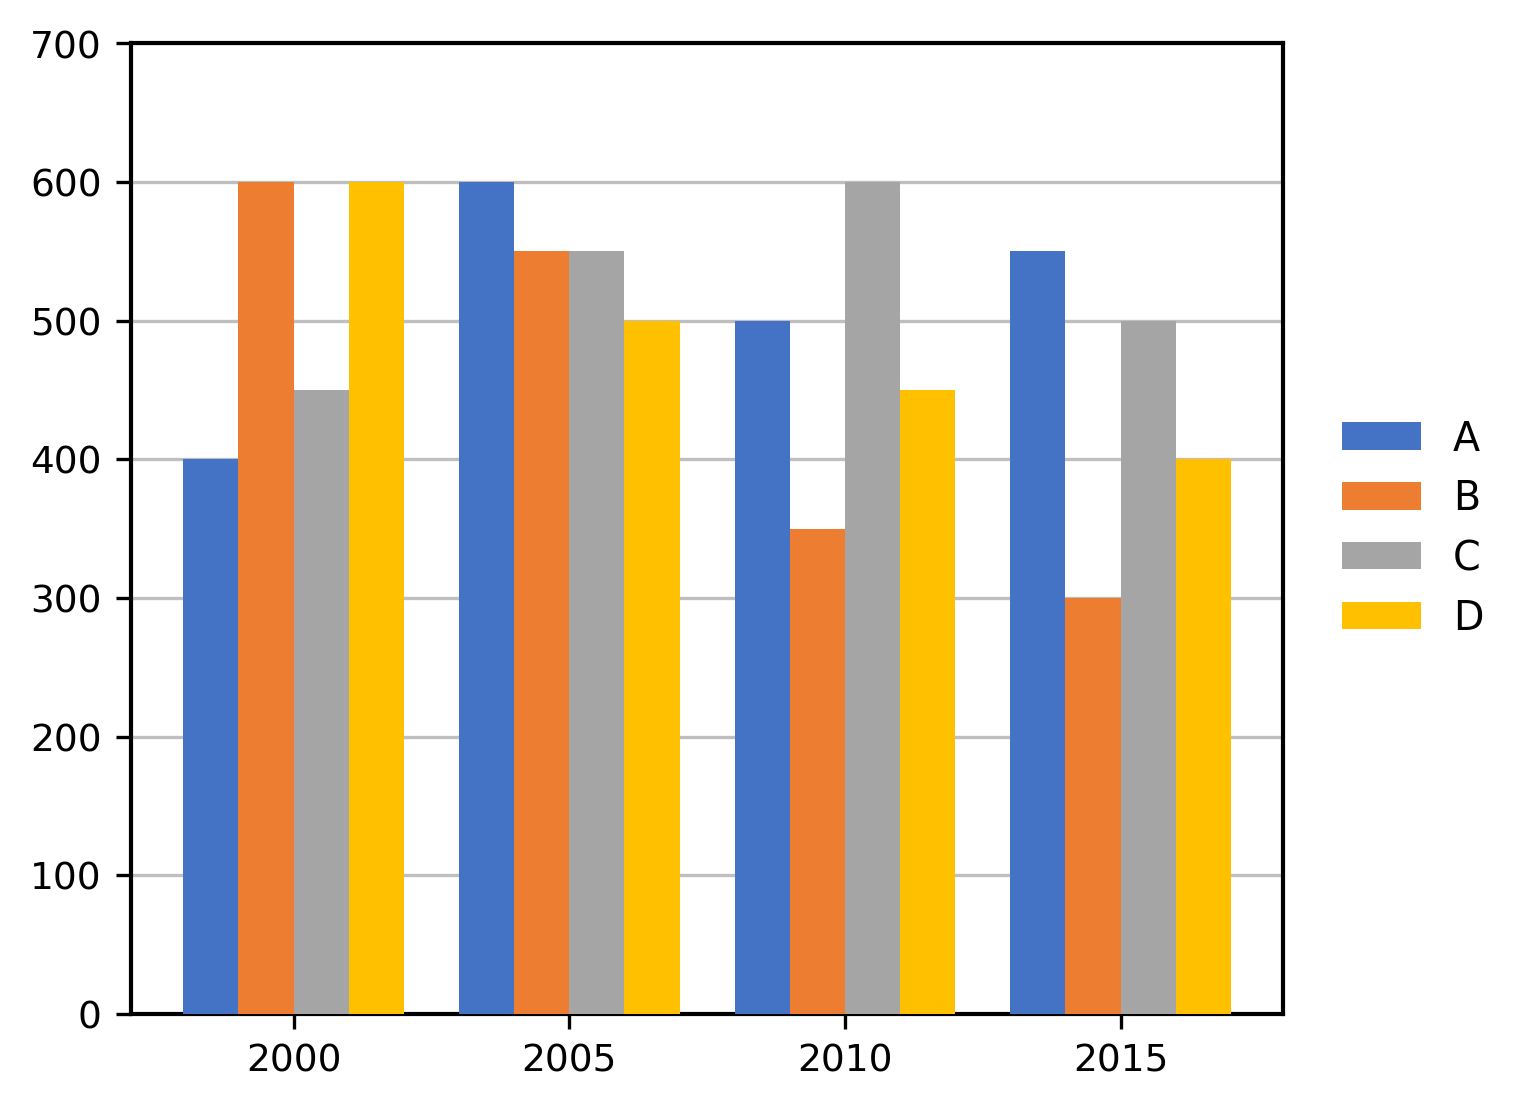
A, B, C and D are different cities, and the given data is of the number of accidents that took place in the respective years 2000, 2005, 2010 and 2015.
If the data for 2020 follows the trend similar to that of 2015, which city is most likely to have a higher number of accidents?
To determine which city is likely to have the highest number of accidents in 2020, we need to analyze the trend from the given data for the years 2000, 2005, 2010, and 2015. The goal is to identify which city had the highest increase or consistent high number of accidents in 2015, as the trend is expected to continue into 2020.
Correct Option: B) City B is most likely to have a higher number of accidents in 2020.
A is 5 times as good as workman as B and therefore is able to complete a job in 60 days less than B. In how many days will they finish it working together?
14 \( \frac{1}{2} \)days
12 \( \frac{1}{2} \) days
14 days
12 days
This problem involves work and time. We are given the relative efficiencies of two workers, A and B, and the difference in time they take to complete a job individually. We need to find the time they take to complete the job together. The key is to relate efficiency to the time taken and then use the concept of combined work rate.
Relate efficiency and time: If A is 5 times as good a workman as B, it means A is 5 times more efficient than B. Therefore, A will take \(\frac{1}{5}\) of the time B takes to complete the same job.
Let \(T_A\) be the time taken by A to complete the job.
Let \(T_B\) be the time taken by B to complete the job.
From the problem statement, we have: \[ T_A = \frac{1}{5} T_B \]
Use the given time difference: We are given that A completes the job in 60 days less than B. So, \[ T_B - T_A = 60 \text{ days} \]
Solve for individual times: Substitute the first equation into the second one:
\[ T_B - \frac{1}{5} T_B = 60 \]
\[ \frac{4}{5} T_B = 60 \]
\[ T_B = \frac{60 \times 5}{4} = 15 \times 5 = 75 \text{ days} \]
Now, find \(T_A\):
\[ T_A = \frac{1}{5} T_B = \frac{1}{5} \times 75 = 15 \text{ days} \]
Calculate their combined work rate:
A's one day's work = \[\frac{1}{T_A} = \frac{1}{15}\] of the job.
B's one day's work = \[\frac{1}{T_B} = \frac{1}{75}\] of the job.
Combined one day's work of A and B = \[\frac{1}{15} + \frac{1}{75}\]
To add these fractions, find a common denominator, which is 75:
\[ \frac{1}{15} + \frac{1}{75} = \frac{5}{75} + \frac{1}{75} = \frac{5+1}{75} = \frac{6}{75} \]
This fraction can be simplified by dividing both numerator and denominator by 3:
\[ \frac{6}{75} = \frac{2}{25} \]
So, A and B together complete \(\frac{2}{25}\) of the job in one day.
Find the total time to complete the job together:
If they complete \(\frac{2}{25}\) of the job in one day, they will complete the entire job (1 unit of work) in the reciprocal of this rate:
Time together = \[\frac{1}{\text{combined work rate}} = \frac{1}{\frac{2}{25}} = \frac{25}{2}\] days.
\[ \frac{25}{2} = 12 \frac{1}{2} \text{ days} \]
Correct Option: B) 12 \( \frac{1}{2} \) days
The question asks to identify the gas essential for photosynthesis. Photosynthesis is the process by which green plants and some other organisms use sunlight to synthesize foods with the help of chlorophyll. This process converts light energy into chemical energy, which is stored in carbohydrate molecules.
Correct Option: A) Carbon dioxide is the gas taken in by plants from the atmosphere and used as a raw material for photosynthesis to produce glucose.
The problem asks us to find the relationship between the first two terms (BILR and EFOO) and apply the same relationship to the third term (CJPT) to find the fourth term. This is a letter-analogy problem where we need to identify the pattern of letter shifts or transformations.
Correct Option: B) FGSQ
The question asks to identify the person who made the statement: "Nobody holds any patent rights in the fundamental ideas of a constitution," in response to criticism about borrowing features for the Indian Constitution. This requires knowledge of the debates and prominent figures involved in the drafting of the Indian Constitution.
D) Dr. BR Ambedkar — This statement was indeed made by Dr. B.R. Ambedkar while defending the Indian Constitution against criticisms of being a borrowed document. He emphasized that constitutional principles are universal and not proprietary to any single country.
To find the sum of numbers between 400 and 600 that are perfectly divisible by 6, 12, and 16, we first need to find the Least Common Multiple (LCM) of these three numbers. This LCM will be the smallest number that is divisible by all three. Then, we identify the multiples of this LCM that fall within the given range and sum them up.
We can use prime factorization to find the LCM.
The LCM is the product of the highest powers of all prime factors involved:
\[ \text{LCM}(6, 12, 16) = 2^4 \times 3 = 16 \times 3 = 48 \]We need to find the smallest multiple of 48 that is greater than 400 and the largest multiple of 48 that is less than 600.
The numbers are 432, 480, 528, and 576.
Sum \( = 432 + 480 + 528 + 576\)
Sum \( = 2016\)
D) 2016 is the correct sum of the numbers between 400 and 600 that are perfectly divisible by 6, 12, and 16.
The question asks to identify which of the given literary works was written by Munshi Premchand. This requires knowledge of prominent Indian authors and their famous works.
D) Sevasadan
"Sevasadan" (originally published in Urdu as "Bazaar-e-Husn") is a famous Hindi novel written by Munshi Premchand. It was first published in 1919 and deals with social issues such as prostitution and the plight of women in Indian society. It is considered one of his most significant works.
The question asks to identify Mahatma Gandhi's political mentor. This is a factual question related to Indian history and the life of Mahatma Gandhi. Recall key figures who influenced Gandhi's political thought and actions.
Correct Option: D) Gopal Krishna Gokhale was indeed considered by Mahatma Gandhi as his political mentor. Gokhale, a moderate leader, advised Gandhi on his initial steps in Indian politics and greatly influenced his approach.
The question asks to identify the individual widely recognized as the "father of computers." This requires knowledge of the history of computing and key figures who made foundational contributions.
Correct Option: A) Charles Babbage is widely regarded as the "father of computers." He was a British mathematician and inventor who conceptualized the first automatic digital computer. His designs for the Difference Engine and, more importantly, the Analytical Engine in the 19th century included many features found in modern computers, such as a programmable memory, an arithmetic logic unit, and conditional branching. Although he couldn't fully build his Analytical Engine during his lifetime, his detailed designs and principles were foundational to the development of computing.
This question tests knowledge about the history and geography of oil exploration in India, specifically in Assam. The key is to identify the very first location where oil was successfully drilled in the state.
Correct Option: D) Digboi
Digboi, located in the Tinsukia district of Assam, holds the distinction of being the site of the first oil well in India. Oil was discovered here in 1889, and the first refinery was established in 1901. This marked the beginning of the oil industry in India.