
The question asks to identify the recipient of the CEAT International Cricketer of the Year Award for 2017. This is a factual question related to sports awards and requires knowledge of contemporary cricket.
D) Ravichandran Ashwin was awarded the CEAT International Cricketer of the Year in 2017. He received this award for his exceptional performance, particularly in Test cricket, during the 2016-17 season where he was the world's top-ranked bowler and all-rounder.
To find the square root of 7569, we can use either the long division method or estimation combined with checking the last digit. Given the options, estimation is a faster approach.
A) 87 is the correct option because \(87 \times 87 = 7569\).
To determine the group and period of an element from its electronic configuration, we need to understand how these properties are related to the arrangement of electrons in shells. The number of shells occupied by electrons indicates the period, and the number of valence electrons (electrons in the outermost shell) indicates the group number (for main group elements).
Based on these steps, the element belongs to Group 16 and Period 3.
Correct Option: B) 16 group and 3 period
The graph below shows the expenditure of a public sector company ‘ABC’ under different heads for the financial year 2015-16.
How much did company ABC spend on infrastructure in 2015-2016?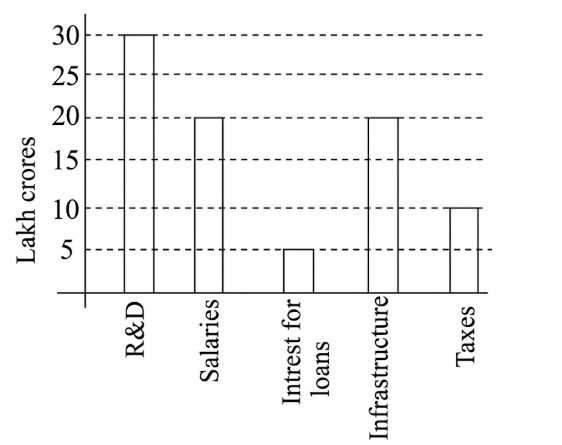
20 lakh crores
30 lakh crores
40 lakh crores
5 lakh crores
The question requires us to determine the expenditure of company ABC on infrastructure for the financial year 2015-16, using the provided bar graph.
Correct Option: A) 20 lakh crores
This is a blood relation question. We need to break down the relationship described step-by-step, starting from the innermost relation and working outwards to determine the final relationship to Madhuri.
D) Paternal Grandfather — As deduced, the person is Madhuri's father's father, which makes him her Paternal Grandfather.
When a wire is doubled on itself, its length is halved, and its cross-sectional area is doubled. We will use the formula for resistance, which relates resistance to resistivity, length, and cross-sectional area, to calculate the new resistance.
Initial Resistance:
Let the initial length of the wire be \(L\), and its initial cross-sectional area be \(A\). The resistivity of the material is \(\rho\). The initial resistance \(R_1\) is given by:
\[ R_1 = \rho \frac{L}{A} \]Given \(R_1 = 5 \, \Omega\).
Changes when the wire is doubled on itself:
When the wire is doubled on itself, it means the wire is folded in half. This changes its effective length and cross-sectional area.
New Resistance:
The new resistance \(R_2\) can be calculated using the new length \(L'\) and new area \(A'\), with the same resistivity \(\rho\):
\[ R_2 = \rho \frac{L'}{A'} \]Substitute the expressions for \(L'\) and \(A'\):
\[ R_2 = \rho \frac{\frac{L}{2}}{2A} \] \[ R_2 = \rho \frac{L}{4A} \]We can rewrite this in terms of the initial resistance \(R_1\):
\[ R_2 = \frac{1}{4} \left( \rho \frac{L}{A} \right) \] \[ R_2 = \frac{1}{4} R_1 \]Calculate the final value:
Given \(R_1 = 5 \, \Omega\), substitute this value:
\[ R_2 = \frac{1}{4} \times 5 \, \Omega \] \[ R_2 = 1.25 \, \Omega \]A) 1.25 Ω is the correct calculated new resistance.
What is the answer of
\( \frac{1}{6} \) + \( \frac{1}{12} \) + \( \frac{1}{20} \) + \( \frac{1}{30} \) + \( \frac{1}{42} \) + \( \frac{1}{56} \) =?
\( \frac{11}{24} \)
\( \frac{3}{8} \)
\( \frac{7}{6} \)
\( \frac{13}{28} \)
The problem asks us to find the sum of a series of fractions. Each denominator in the series can be expressed as a product of two consecutive integers. This suggests using the partial fraction decomposition method, where each term \(\frac{1}{n(n+1)}\) can be written as \[\frac{1}{n} - \frac{1}{n+1}\]. This will lead to a telescoping series.
Correct Option: B) \( \frac{3}{8} \)
The question asks to identify the statement that is NOT true about the vascular system, specifically focusing on blood. We need to evaluate each option based on biological facts related to blood and the circulatory system.
Correct Option: A) Blood is only white vascular connective tissue.
Pick the figure that will complete the given series
Problem figure: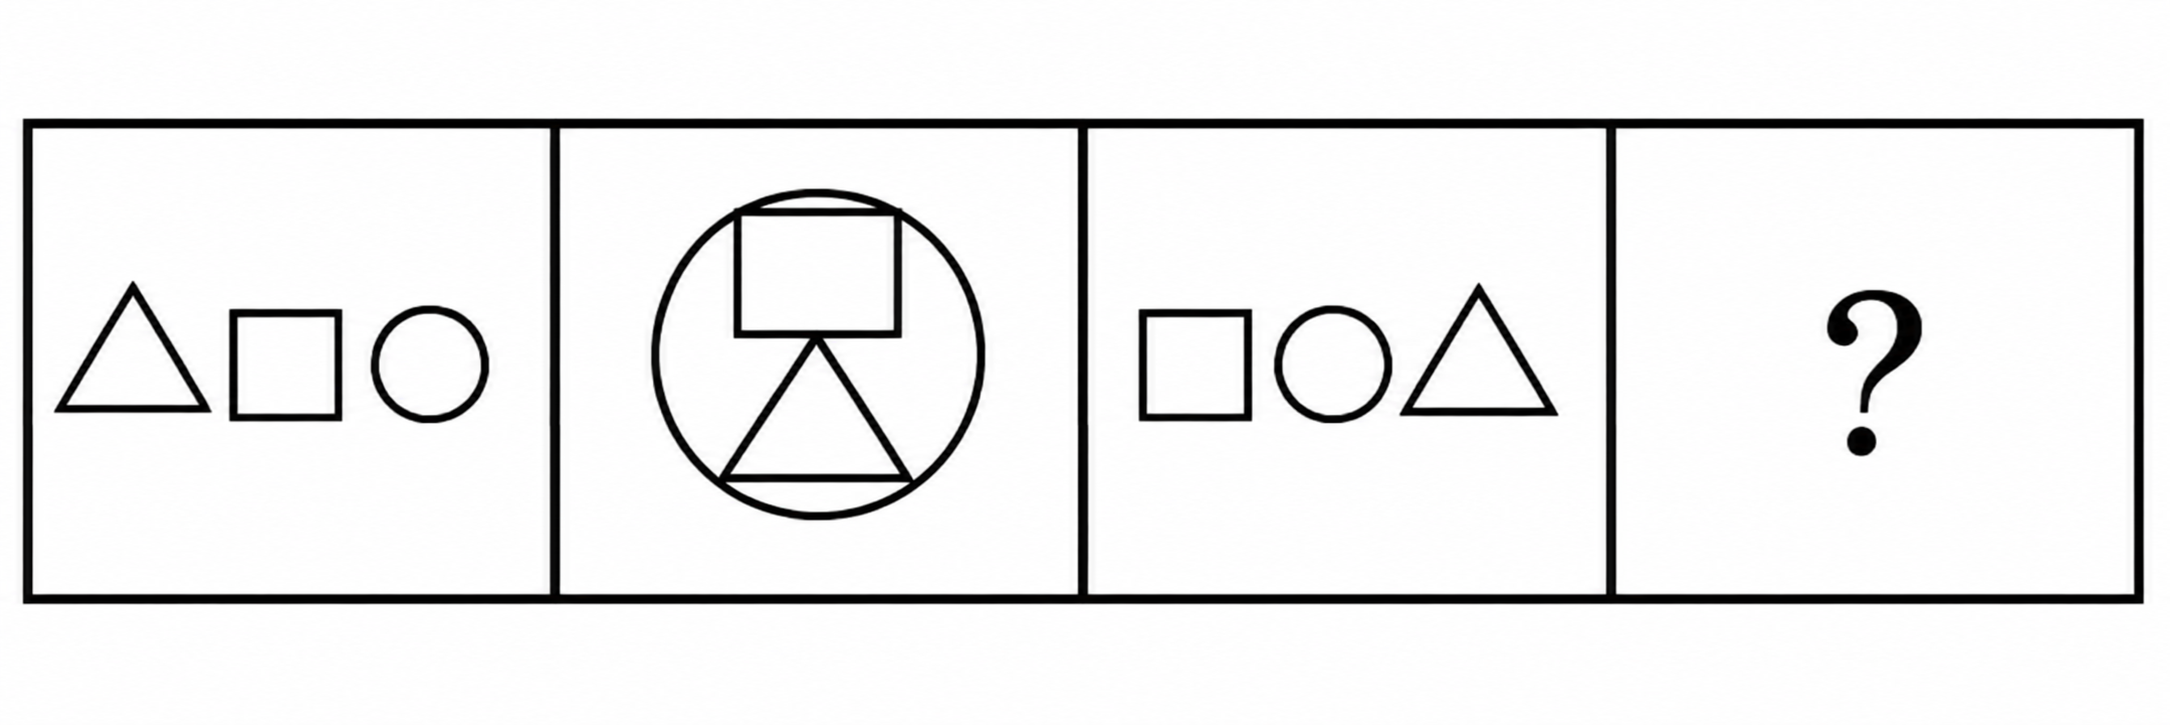
Answer figure: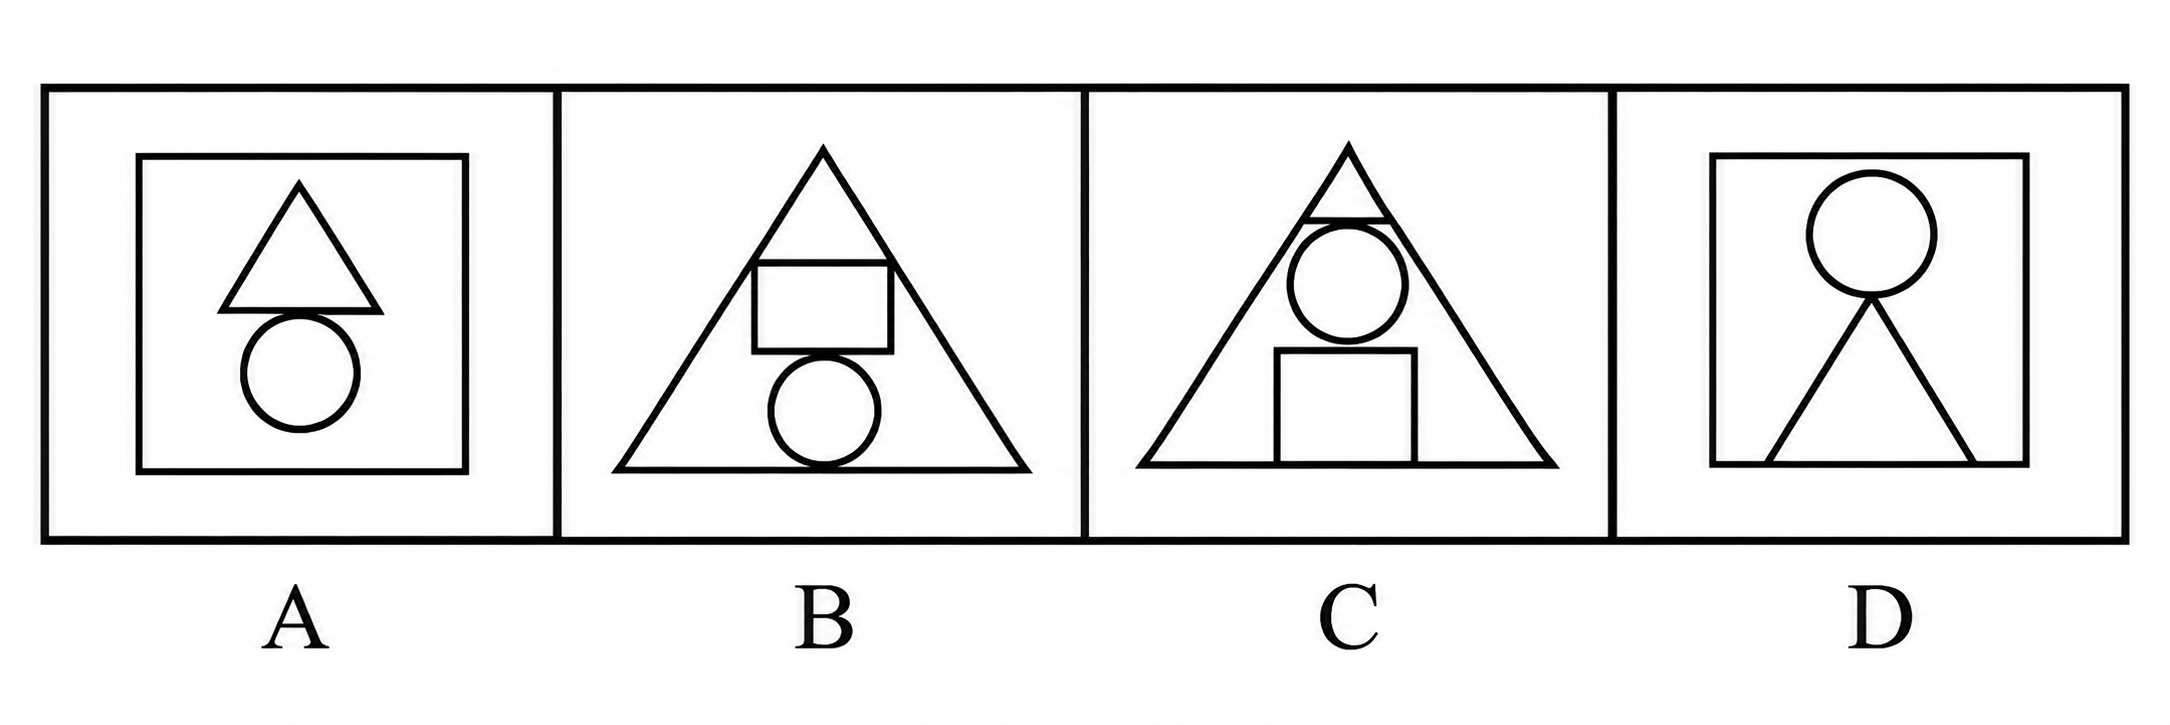
The problem involves identifying the pattern in a series of figures and selecting the figure that logically completes the series. The key is to observe the arrangement and transformation of shapes within the given diagrams.
Correct Option: B) The nested arrangement with a triangle enclosing a square and a circle fits the pattern.
The question asks to identify the Indian nominee who was re-elected to the International Court of Justice (ICJ) in November 2017 after Britain withdrew its candidate. This requires knowledge of significant international appointments and events related to India's presence in global bodies.
A) Dalveer Bhandari — Justice Dalveer Bhandari was indeed India's nominee for the International Court of Justice in November 2017 and was re-elected after Britain withdrew its candidate.