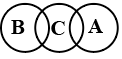
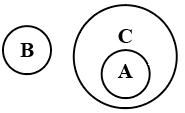
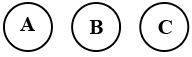
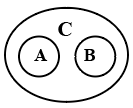
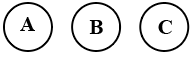
Which of the following Venn diagrams correctly represents the relationship between the following classes?
A) Telephone
B) Aeroplane
C) Spider
To solve this question, we need to determine the logical relationship between the classes: Telephone, Aeroplane, and Spider. These are distinct categories with no overlap or hierarchical relationship.
Correct Option: C) The diagram shows three separate circles, each representing one of the classes (A, B, C), indicating no overlap or relationship among them.
To solve this problem, we need to follow the order of operations (BODMAS/PEMDAS). This means we first evaluate expressions inside brackets, then perform division, and finally addition/subtraction. We will evaluate the numerator and the denominator separately and then divide the results.
The numerator is \(39 - (19 - 44)\).
First, solve the innermost bracket: \(19 - 44\).
\[ 19 - 44 = -25 \]Now substitute this back into the numerator expression:
\[ 39 - (-25) \]Subtracting a negative number is equivalent to adding its positive counterpart:
\[ 39 + 25 = 64 \]So, the numerator is \(64\).
The denominator is \(-4 \times 3 - (-4)\).
First, perform the multiplication:
\[ -4 \times 3 = -12 \]Now substitute this back into the denominator expression:
\[ -12 - (-4) \]Again, subtracting a negative number is equivalent to adding its positive counterpart:
\[ -12 + 4 = -8 \]So, the denominator is \(-8\).
Now, divide the numerator by the denominator:
\[ \frac{64}{-8} \]Dividing a positive number by a negative number results in a negative number:
\[ \frac{64}{-8} = -8 \]D) The final result of the expression is \(-8\).
If in a code language LEAP is written as MFBQ, then how would JUMP be written in that same language?
The problem presents a coding-decoding scenario. We need to identify the pattern used to transform "LEAP" into "MFBQ" and then apply the same pattern to "JUMP" to find its coded form.
Correct Option: C) KVNQ
We are given a problem involving the volume of a cube. We need to find the original edge length of the cube given how its volume changes when the edge length is increased. We will set up an equation based on the volume formula for a cube and solve for the original edge length.
Let the original length of each edge of the cube be \(x\) cm.
The original volume of the cube, \(V_1\), is given by the formula for the volume of a cube:
\[ V_1 = x^3 \]If the edge of the cube is increased by 4 cm, the new edge length will be \((x + 4)\) cm.
The new volume of the cube, \(V_2\), will be:
\[ V_2 = (x + 4)^3 \]According to the problem, the volume increases by 988 cm³. This means the difference between the new volume and the original volume is 988 cm³:
\[ V_2 - V_1 = 988 \]Substitute the expressions for \(V_1\) and \(V_2\) into the equation:
\[ (x + 4)^3 - x^3 = 988 \]Expand \((x + 4)^3\) using the identity \((a + b)^3 = a^3 + 3a^2b + 3ab^2 + b^3\):
\[ x^3 + 3(x^2)(4) + 3(x)(4^2) + 4^3 - x^3 = 988 \]\[ x^3 + 12x^2 + 48x + 64 - x^3 = 988 \]Simplify the equation:
\[ 12x^2 + 48x + 64 = 988 \]Subtract 988 from both sides to form a quadratic equation:
\[ 12x^2 + 48x + 64 - 988 = 0 \]\[ 12x^2 + 48x - 924 = 0 \]Divide the entire equation by 12 to simplify:
\[ \frac{12x^2}{12} + \frac{48x}{12} - \frac{924}{12} = 0 \]\[ x^2 + 4x - 77 = 0 \]Solve the quadratic equation. We can factor it or use the quadratic formula. Factoring the quadratic equation \(x^2 + 4x - 77 = 0\), we look for two numbers that multiply to -77 and add to 4. These numbers are 11 and -7.
\[ (x + 11)(x - 7) = 0 \]This gives two possible values for \(x\):
\[ x + 11 = 0 \implies x = -11 \]\[ x - 7 = 0 \implies x = 7 \]Since the length of an edge cannot be negative, we discard \(x = -11\).
Therefore, the original length of each edge of the cube is 7 cm.
A) 7 cm is the correct answer, as derived from solving the equation.
This problem involves work and time. We need to determine the individual time B takes to complete the entire work. We can solve this by calculating the fraction of work done by A and B together, the remaining work, and then using B's time to complete that remaining work to find B's total work rate.
Let the total work be 1 unit.
A and B together can complete the work in 20 days. So, their combined work rate is:
\[ \text{Work done by (A + B) in 1 day} = \frac{1}{20} \text{ units/day} \]They worked together for 15 days. The amount of work completed by them in 15 days is:
\[ \text{Work done in 15 days} = 15 \times \frac{1}{20} = \frac{15}{20} = \frac{3}{4} \text{ units} \]After A left, the remaining work is:
\[ \text{Remaining work} = 1 - \frac{3}{4} = \frac{1}{4} \text{ units} \]B finishes this remaining \(\frac{1}{4}\) unit of work alone in 18 days. So, B's work rate is:
\[ \text{Work done by B in 1 day} = \frac{\text{Remaining work}}{\text{Days taken by B}} = \frac{1/4}{18} = \frac{1}{4 \times 18} = \frac{1}{72} \text{ units/day} \]To find the time B will take to complete the whole work alone, we use B's daily work rate:
\[ \text{Time taken by B to complete whole work} = \frac{\text{Total work}}{\text{B's work rate}} = \frac{1}{1/72} = 72 \text{ days} \]A) 72 days is the correct answer. This is derived from calculating B's daily work rate based on the remaining work and the time B took to complete it.
A food chain company compares profit percentage from two zones for 5 years. Below is the line chart showing details: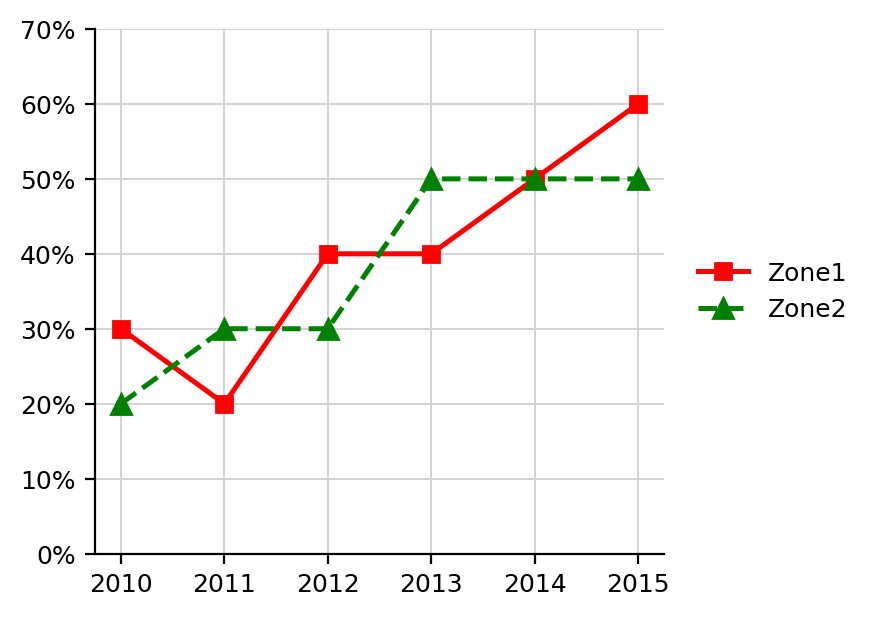
Which option best describes the information presented in the chart?
For the last three consecutive years, Zone 2 has shown no improvement in the profit percentage
There is a steady decrease in the profit over the years
No profit improvement in Zone 1 and Zone 2
Zone 2 shows increase drastically compared to Zone 1
To determine the correct option, we need to analyze the line chart comparing the profit percentages of Zone 1 and Zone 2 over five years.
Correct Option: A) For the last three consecutive years, Zone 2 has shown no improvement in the profit percentage.
This question asks to identify Newton's Second Law of Motion from the given options. We need to recall the precise statement of each of Newton's laws to correctly answer this.
Correct Option: C) The rate of change of momentum of an object is proportional to the net force applied on the object in the direction of net force.
The question gives the ratio of sand to gravel as 17 : 9 and the ratio of gravel to cement as 6 : 17. To find the ratio of sand to cement, we need to make the quantity of gravel equal in both ratios and then compare the corresponding quantities of sand and cement.
Identify the given ratios:
We need to find the ratio of sand to cement.
Find the LCM of the gravel terms:
The gravel terms in the two ratios are 9 and 6.
\[ \text{LCM of 9 and 6}=18 \]Therefore, we need to make the gravel term equal to 18 in both ratios.
Adjust the ratio of sand to gravel:
Multiply both terms of 17 : 9 by 2.
\[ 17:9=34:18 \]Therefore:
Sand : Gravel = 34 : 18
Adjust the ratio of gravel to cement:
Multiply both terms of 6 : 17 by 3.
\[ 6:17=18:51 \]Therefore:
Gravel : Cement = 18 : 51
Combine the ratios:
Since the gravel term is now equal in both ratios, we can combine them.
Sand : Gravel : Cement = 34 : 18 : 51
Therefore:
\[ \text{Sand : Cement}=34:51 \]Dividing both terms by 17:
\[ 34:51=2:3 \]Hence, the required ratio is:
\[ \boxed{2:3} \]Correct Option: D) 2 : 3 — The given ratios are Sand : Gravel = 17 : 9 and Gravel : Cement = 6 : 17. Making the gravel terms equal gives 34 : 18 and 18 : 51. Therefore, Sand : Cement = 34 : 51 = 2 : 3. Hence, Option D is the correct answer.
A) 17 : 17: This is incorrect because the quantities of sand and cement are not equal. Combining the given ratios gives Sand : Cement = 2 : 3, not 1 : 1.
B) 289 : 54: This is incorrect because the terms of the two ratios have been combined in the wrong order. The correct ratio is obtained by matching the common gravel quantity, giving Sand : Cement = 2 : 3.
C) 9 : 6: This is incorrect because 9 and 6 represent the gravel terms in the two given ratios, not the quantities of sand and cement. The required ratio is 2 : 3.
The question asks to identify the winner of the Syed Mushtaq Ali T20 Trophy in the year 2018. This requires knowledge of past sports event results, specifically in Indian domestic cricket.
C) Delhi won the Syed Mushtaq Ali T20 Trophy in 2018 (for the 2017-18 season), defeating Rajasthan in the final.
The question asks to identify the son of Hamida Banu Begum. This requires knowledge of the lineage of the Mughal emperors of India.
Correct Option: C) Emperor Akbar