
The following pie chart shows information on the sales of a toy making company ‘XYZ’ during the financial year 2017-18. The total revenue generated from the sale of all the toys is Rs. 38,72,000.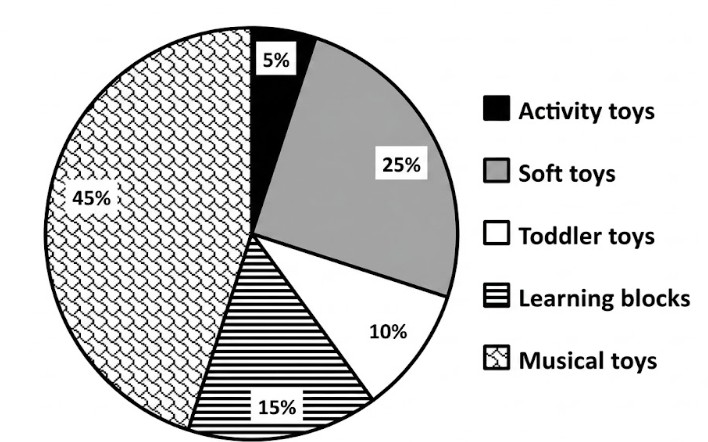
How much of this revenue was generated from learning blocks?
Rs. 1,74,240
Rs. 7,74,400
Rs. 1,93,600
Rs. 5,80,800
To find the revenue generated from learning blocks, we need to use the percentage given in the pie chart and apply it to the total revenue.
Revenue from learning blocks = Total revenue × Percentage of learning blocks
Given:
Substitute the values into the formula:
\[ \text{Revenue from learning blocks} = 38,72,000 \times \frac{15}{100} \]Calculate the result:
\[ \text{Revenue from learning blocks} = 38,72,000 \times 0.15 = 5,80,800 \]Therefore, the revenue generated from learning blocks is Rs. 5,80,800.
Correct Option: D) Rs. 5,80,800
How many triangles are there in the following figure?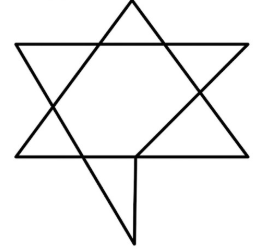
To determine the number of triangles in the given figure, we need to systematically identify all possible triangles formed by the intersecting lines.
Correct Option: B) 7
To solve this problem, we need to first convert the total volume of acid in the barrel into a single unit (milliliters). Then, we will divide the total volume by the capacity of each small container to find out how many containers can be filled.
We know that \(1 \text{ L} = 1000 \text{ mL}\).
So, \(4 \text{ L} = 4 \times 1000 \text{ mL} = 4000 \text{ mL}\).
The barrel has \(4 \text{ L}\) and \(500 \text{ mL}\) of acid.
Total volume = \(4000 \text{ mL} + 500 \text{ mL} = 4500 \text{ mL}\).
Each container has a capacity of \(25 \text{ mL}\).
Number of containers = \[\frac{\text{Total volume of acid}}{\text{Capacity of one container}}\]
Number of containers = \( \frac{4500 \text{ mL}}{25 \text{ mL}} \)
Number of containers = \(180\).
Thus, 180 containers, each of capacity 25 mL, can be filled.
Correct Option: B) 180
The question asks to identify the component that carries hereditary material. This requires knowledge of basic genetics and cell biology.
B) DNA — Deoxyribonucleic acid (DNA) is the primary hereditary material in almost all living organisms, including humans, animals, plants, and many viruses. It contains the genetic instructions used in the development and functioning of all known living organisms and many viruses. It carries the codes for making proteins and other essential molecules, thus determining the traits passed down from parents to offspring.
The problem presents a numerical analogy where we need to find the relationship between the first pair of numbers and apply the same relationship to the second pair to find the missing number. We will analyze the relationship between 16 and 56 and then apply that pattern to 32.
We need to find a mathematical operation or a series of operations that transforms 16 into 56. Let's try multiplication and addition/subtraction.
Using the pattern \((N \times 3) + (N/2)\) or \(N \times 3.5\):
\[ 32 \times 3.5 = 32 \times \frac{7}{2} \]\[ = 16 \times 7 \]\[ = 112 \]The calculated value is 112, which matches option A.
Correct Option: A) 112
To find the acute angle between the diagonals of a rectangle, we will use the properties of rectangles, specifically that diagonals bisect each other and are equal in length. This creates isosceles triangles within the rectangle, allowing us to use the angle sum property of triangles.
Correct Option: B) 50°
Which of the option figures comes next?
Problem figure: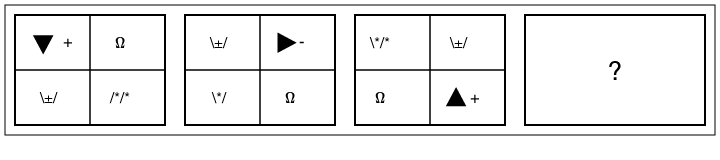
Answer Figures: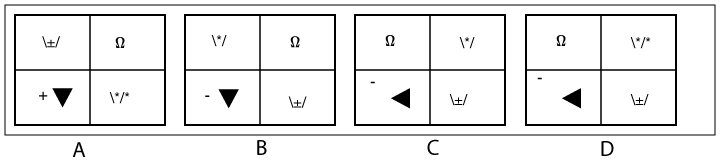
To solve this problem, we need to identify the pattern in the sequence of figures and determine which option logically follows the given sequence.
Correct Option: B) The pattern continues with the triangle rotating and moving to the bottom-left quadrant.
The SI unit of acceleration is ___________.
To determine the SI unit of acceleration, we need to recall its definition and the SI units of the fundamental quantities involved (distance and time).
Correct Option: D) m/s 2
If tan α = \( \sqrt{5} \) – 2, then the value of tan α – cot α =?
To find the value of \( \tan \alpha - \cot \alpha \), we are given the value of \( \tan \alpha \). We know that \( \cot \alpha \) is the reciprocal of \( \tan \alpha \). So, we first calculate \( \cot \alpha \) and then substitute both values into the expression.
We are given that \( \tan \alpha = \sqrt{5} - 2 \).
We know that \( \cot \alpha = \frac{1}{\tan \alpha} \).
So, substitute the given value of \( \tan \alpha \):
\[ \cot \alpha = \frac{1}{\sqrt{5} - 2} \]To simplify this expression, we rationalize the denominator by multiplying the numerator and denominator by the conjugate of the denominator, which is \( \sqrt{5} + 2 \):
\[ \cot \alpha = \frac{1}{\sqrt{5} - 2} \times \frac{\sqrt{5} + 2}{\sqrt{5} + 2} \] \[ \cot \alpha = \frac{\sqrt{5} + 2}{(\sqrt{5})^2 - (2)^2} \]Using the identity \( (a-b)(a+b) = a^2 - b^2 \):
\[ \cot \alpha = \frac{\sqrt{5} + 2}{5 - 4} \] \[ \cot \alpha = \frac{\sqrt{5} + 2}{1} \] \[ \cot \alpha = \sqrt{5} + 2 \]Now substitute the values of \( \tan \alpha \) and \( \cot \alpha \) into the expression:
\[ \tan \alpha - \cot \alpha = (\sqrt{5} - 2) - (\sqrt{5} + 2) \] \[ \tan \alpha - \cot \alpha = \sqrt{5} - 2 - \sqrt{5} - 2 \]Combine like terms:
\[ \tan \alpha - \cot \alpha = (\sqrt{5} - \sqrt{5}) + (-2 - 2) \] \[ \tan \alpha - \cot \alpha = 0 - 4 \] \[ \tan \alpha - \cot \alpha = -4 \]Correct Option: C) -4
As per the following table, how many months have the same price for vegetables over the 2-year timeframe?
| Months | Price per kg (in Rs.) – Year 1 | Price per kg (in Rs.) – Year 2 |
| Jan | 40 | 35 |
| Feb | 30 | 50 |
| Mar | 40 | 35 |
| Apr | 80 | 80 |
| May | 80 | 80 |
| Jun | 80 | 80 |
| Jul | 80 | 80 |
| Aug | 50 | 60 |
| Sep | 50 | 40 |
| Oct | 50 | 50 |
To find the number of months with the same price for vegetables over the two-year timeframe, we need to compare the price per kg for each month in Year 1 with the corresponding month in Year 2, as provided in the table. We will count how many months have identical prices in both years.
Correct Option: A) 5